The online tool provides weekly updates on flu activity across states and cities, highlighting regions with the highest increases and historical trends.
RT’s Three Key Takeaways:
- Real-Time Flu Tracking: The Walgreens Flu Index provides weekly updates on flu activity, allowing users to view regional trends and compare current data to past seasons.
- Focus on Geographic Hotspots: The index identifies states and markets experiencing the highest flu activity and week-over-week increases, offering insights for healthcare providers and the public.
- Expanded Respiratory Illness Monitoring: In addition to flu data, the index captures trends in respiratory illnesses with similar symptoms, supporting broader public health awareness.
Walgreens has launched the 2024-2025 Walgreens Flu Index, an online, interactive tool that tracks weekly flu activity based on flu-related prescription data across the company’s community pharmacy locations nationwide.
The Walgreens Flu Index ranks the top markets and states for flu activity in the United States, including Puerto Rico, and the top markets and states showing the largest increases in flu activity week-over-week. The index is updated weekly each Tuesday. Users can search by market or state to see where their geographic area ranks for flu activity in any given week and how current flu activity compares to last season.
Through the time-lapse feature of the Walgreens Flu Index, users can see how current flu activity compares to activity from last season.
Every week, Walgreens tracks the incremental change of antiviral medications used to treat influenza across thousands of Walgreens and Duane Reade locations nationwide to create the Walgreens Flu Index. Data for the Walgreens Flu Index is analyzed at state and geographic market levels to measure absolute impact and incremental change of antiviral medications on a per store average basis and does not include markets in which Walgreens has fewer than 10 retail locations.
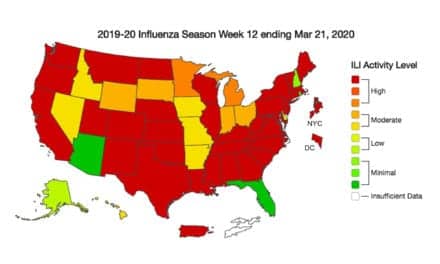
The index is not intended to illustrate flu severity, but rather, based on this methodology, to show which populations are experiencing the highest incidence of influenza within the United States and Puerto Rico each week. Low-high rankings are designated based on a normal flu season, defined by an average of the last five flu seasons nationwide. For example, red regions on the Walgreens Flu Index map indicate a much higher than normal flu season, while green regions indicate a much lower than normal flu season.
Tracking Respiratory Virus Activity
Over the last three years, Walgreens has seen other respiratory illness activity captured through this index as respiratory symptoms across disease states can be similar. Walgreens continues to refine this surveillance platform with available data streams.
For 11 years, the Walgreens Flu Index has provided a view of disease trends. Historical data from the Walgreens Flu Index shows that southern states tend to see earlier and steeper peaks in flu activity when compared to the rest of the country.
“We continue to monitor the emergence of respiratory illnesses, and the Flu Index has been a reliable view of disease spread,” says Rick Gates, chief pharmacy officer, in a news release. “Our goal is to protect communities from flu, as well as other seasonal viruses like COVID-19 and RSV.”
Even though early data shows lower initial activity, a seasonal spike is predicted to be around the corner.
ID 177136961 © Scaliger | Dreamstime.com